For support ops managers
Your helpdesk tells you
what happened.
BTA tells you what's
about to go wrong.
One connection. Three audits. Every ticket scored by risk, ranked by urgency, delivered to your inbox — before you open your helpdesk.
No credit card required. Subscription from $49/mo.
We never store your ticket data — fetched, scored, discarded.
Sample audit · 4,200-ticket Zendesk queue
over 90 days
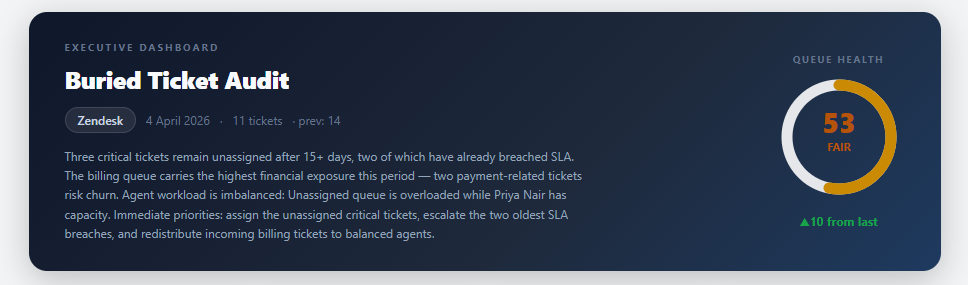

This is what lands in your inbox. Every ticket. Scored. Ranked. Ready to act on.
What you get in your inbox.
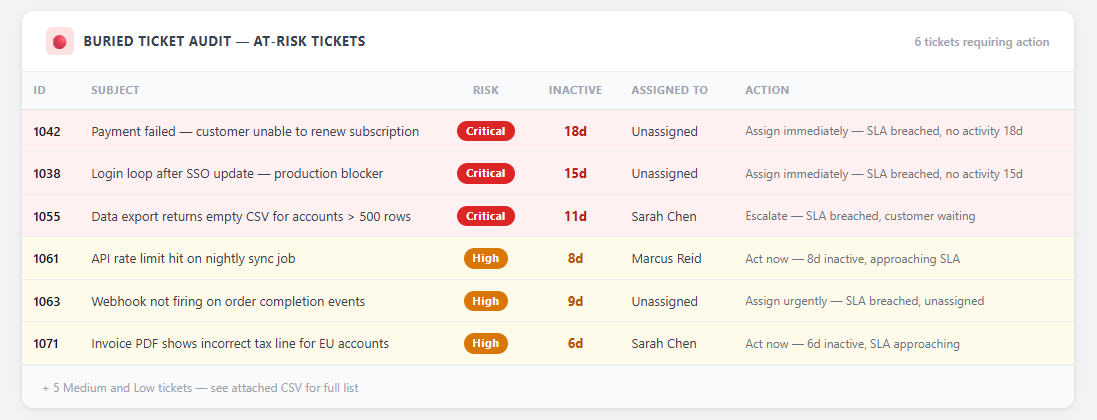
Pro — every at risk ticket ranked, scored, and delivered to your inbox.
Tells you what to do. Not just what happened.
Every Executive report opens with an AI-written briefing — what's at risk this period, which tickets are heading toward escalation, and the three actions to take today. No interpretation required.
Sound familiar?
These are real words from real support managers.
“
We have been losing customer tickets for three months and nobody noticed.
“
Tickets disappearing into unmonitored inboxes.
“
SLA breaches we didn't catch until the customer escalated.
“
Reporting is another mess — dashboards that show averages, not answers.
The gap
Every helpdesk measures the same things the same way.
Averages. Totals. Response time medians. All of it tells you what already happened. None of it tells you which ticket is going to blow up today.
Per-ticket risk scoring
Every ticket gets a risk level based on combined signals — not averages.
Combined signal analysis
Unassigned + SLA breach + days inactive = one urgency score. No competitor combines these.
Workload by risk weight
Agent B has 10 tickets, 4 critical. Agent A has 40 tickets, 0 critical. Completely different problem — invisible in every helpdesk.
Ticket data quality audit
No helpdesk audits its own data. Blank fields, useless subjects, missing SLAs. BTA finds them all.
Proactive email delivery
Finished artifact in your inbox. No login, no query, no dashboard to check.
Executive-ready artifact
Color-coded Excel, HTML dashboard, AI narrative. Ready to present upward. No formatting required.
What this audit checks
Three things your helpdesk won't tell you.
Buried tickets
Every open ticket scored by combined signals — unassigned, SLA breach, days inactive. Critical tickets surface first. Recommended action on every row.
Agent workload by risk weight
Agent B has 10 tickets, 4 critical. Agent A has 40 tickets, 0 critical. Completely different problem — invisible in every helpdesk's reporting.
Ticket data quality
No helpdesk audits its own data. Blank fields, useless subjects, missing SLAs. Your reports are built on bad data — BTA finds them all.
One scan. Three reports.
Everything your helpdesk reporting won't tell you.
Zendesk has 9 report tabs. Freshdesk has dashboards. None of them tell you which ticket to fix first.
Buried Ticket Audit
Which tickets are at risk right now?
Every open ticket scored by combined signals: unassigned, SLA breach, days inactive. Critical tickets surface first. Recommended action on every row.
Workload Distribution Report
Which agents are overloaded?
Workload by risk weight, not ticket count. Agent A has 40 tickets, 0 critical. Agent B has 10 tickets, 4 critical. Completely different problem — invisible in every helpdesk's reporting.
Ticket Data Quality Audit
Which tickets have bad data?
No helpdesk audits its own ticket data. Agents leave fields blank. Subjects are useless. SLAs aren't set. Your reports are built on bad data — and nobody knows.
Setup
Up and running in under 2 minutes.
Connect
Enter your helpdesk credentials. Zendesk or Freshdesk. Takes 30 seconds.
Run
We pull all tickets updated in the last 30 days and score every one.
Receive
Your scored report lands in your inbox within 60 seconds — Critical tickets first, recommended action on every row.
Schedule
Set it to daily or weekly. It runs automatically. You just read the report.
Output
What your audit looks like.
Every row scored and actionable. Delivered to your inbox — not a dashboard to log into.
| Ticket | Inactive | Risk |
|---|---|---|
| API rate limiting causing 500s in production | 29d | critical |
| Login broken for SSO users after last update | 22d | critical |
| Dashboard loading very slowly — 8–12s per page | 12d | high |
| Email notifications not arriving for new comments | 6d | medium |
| How to set up SCIM provisioning with Okta | 1d | low |
Full output includes SLA deadlines, submission dates, assignee, and last activity. Delivered to your inbox within 60 seconds.
No credit card required.
Pricing
Start free. Scale when you need to.
Zendesk Explore costs $115/agent/month. A 50 agent team pays $5,750/month just to see their own data.
BTA starts at $49/month flat — no per agent pricing, no add-ons.
Save 17% with annual billing.
First audit free. Top 5 critical tickets + summary counts.
Full scored CSV for a single run. No subscription.
Starter
Full scored CSV, unlimited runs, daily or weekly scheduling.
Pro
Add the Workload Distribution Report alongside ticket risk.
Executive
Full suite — color-coded Excel, HTML dashboard + boardroom report, AI narrative.
No credit card required.